
How to devise a smart selling plan and see real tech IPO examples you can learn from.
WIth its 2021 rise and 2022 crash, the stock market has been quite a roller coaster these past couple of years.
If your employer went public around 2020, you know firsthand just how unpredictable the market can be. And there’s a chance you didn’t sell your shares in 2021 and watched your position’s value plummet the following year. If that’s the case, you’re not alone; I’ve seen many professionals who regretfully held onto their shares as prices dropped and watched their dreams of a big payday fall into the ether. But there’s good news: Stock market conditions are finally starting to improve and you have a second chance at selling your shares at a good price.
However, the only way you can achieve different results this time around is to break free of your default approach to selling shares. Shifting your mindset might feel uncomfortable, but it’s not as painful as suffering another lost opportunity.
Don’t worry, you don’t have to fend for yourself. In this post, I’ll show you how to develop your plan to sell so that you can make potentially life-changing money and avoid repeating the mistakes of yesteryear.
Disclaimer: Before we dive head-first into the topic, I want to be clear that this blog post is intended to simply share my thoughts around considering when to sell your shares after an IPO. This post is about the general approach and philosophy of how a tech employee should think through developing a sales plan. This information should supplement, rather than replace, professional financial advice that I highly encourage you to seek.
A positive outlook for recent tech IPOs
In March, I wrote about how to cut your losses after riding the tech stock dips. In that post, I made examples of Twilio (TWLO) and Okta (OKTA) stocks, which made their public debuts several years ago, at a time when the IPO market was frozen. These examples are still relevant today, considering the IPO market has been frozen for 18 months and we’re hoping it’ll thaw soon.
Though both Twilio and Okta stocks have negative one-year returns at the writing of this post, there are still positive signs we could be entering into another bull market. Just look at Cava (CAVA), which recently went public and has encouraging stock performance to show for it. I’ve also been eyeing the Renaissance Capital IPO ETF, which is doing really well this year — better than the market as a whole.
This positive outlook underscores the importance of putting together a sales strategy for your stock that went public in 2020 or 2021 now. If this positive upswing continues, you’ll want to be prepared to potentially sell. The last thing you want is to miss another chance to sell when your stock is high.

We’ll take a closer look at three other stocks’ performance and discuss selling strategies for each one. But first, you’ll want to know three key numbers.
3 numbers that should inform your plan
When I meet with tech employees who have a position of shares in their current or former company, one of the main tasks we tackle together is determining good opportunities for them to sell.
I start by pulling up the stock chart online, using a website like morningstar.com (I’m not affiliated, just a happy user!). From there, I focus on three key numbers, and you should too:
1. All-time highs and lows
Since I often deal with companies that have only been publicly traded for a few years, I first look at their all-time highs and lows. Though this metric is not as important as the other ones I consider, viewing a stock’s highest and lowest points can serve as a reminder of what the stock is capable of doing. Knowing your stock can unexpectedly plummet can help you guard against repeating the mistake of not selling in 2021. Remember, the stock market can drop much faster than it can rise.
2. 52-week high and low
A metric that’s more informative and helpful in determining when to sell is your stock’s 52-week high and low. When looking at the stock’s performance, ask yourself how its price today fits into the history of the stock’s last twelve months.Finding your stock’s high and low points from the last year is easier than you think. This info is readily available on the iPhone Stock app, listed as “52W H” and “52W L.”
3. Split price
From there, I recommend calculating the split price, which is the median between the 52-week high and low prices. Feel free to plug your numbers into this simple formula: [ (52W H — 52W L) / 2 + 52W L = split price. Now that you’ve calculated your split price, compare it to the stock’s current price. If the stock’s price today is higher than the split price, that makes it a good price to sell (and vice versa). You always want to sell above the split price if you can.
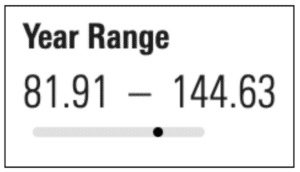
Screenshot from Morningstar.com. Airbnb stock used as an example.
Morningstar makes it easy to visualize where your stock’s price today stands, just look at the image above. The gray bar represents the range between the 52-week high and low, while the black dot represents where the stock’s current price stands. In this example with Airbnb, you can see the stock’s current* price (*at the time of the screenshot capture) falls in the higher half of the range (i.e. above the split price), making the stock’s current price a good sell.
The floor and ceiling approach to stock price
Before diving into specific stock examples, it’s important to understand the principles and approach to take when developing a plan to sell your shares.
The most data-driven principle to devising your sales plan is the financial side of things, which deals with numbers, like stock price and tax implications. Three main factors (yes, another list of three things) drive the success of any sales strategy: price, shares, and taxes. The first of which is always the most important. Some tech professionals make the mistake of not selling when they should because of taxes — either to avoid a lofty tax bill or to wait and pay tax at a lower rate. However, stocks are unpredictable and prices can move so fast they diminish any advantage you were hoping to gain by delaying your sale. When deciding when to sell, disregard taxes and shift your focus to price.
If you remember nothing else, consider selling anytime you like the price you sell at today.
Price is the most important thing.
A less numbers-heavy principle is the personal side. This has to do with your goals surrounding the life you want to have. If you have a specific goal — like purchasing a house or achieving financial independence — and can assign a dollar amount that would sufficiently fund it, then I’d encourage you to sell any time you have a combination of price and shares that, after taxes, will fund your goal. It’s important to act quickly when your goals are within reach, otherwise you risk watching your goals slip away as soon as the stock price dips. If you don’t have specific goals and you don’t need the cash, it’s okay to wait before you sell your shares. However, waiting to sell isn’t a reason to procrastinate making a plan. Having a plan will help you avoid any catastrophic losses that may occur.
Another principle at play here is the reality of an uncertain future. It’s impossible to know the future stock price and it’s impossible to know the perfect moment to sell. Get comfortable with the fact that your selling plan is partly a guessing game. With this uncertainty at play, a good plan is one in which you sell your shares over time and at different prices. Strive for a higher average sales price than if you just sold a fixed number at fixed intervals, regardless of price. That means selling above the split price (the number we calculated in the section above). When the stock is going up, you need a floor. That means whenever you’re above the split price, you need to know how much loss from the current price are you willing to endure before you start selling? And when the stock is going down and you’re below the split price, you need a ceiling. In other words, how long will you wait and how much gain are you hoping to get before you trigger a sale?
3 real tech IPOs to learn from
You can learn a lot from history and avoid repeating mistakes you or others made in the past. By this same token, we’ll look at three tech IPOs from 2020: Airbnb, Snowflake, and Palantir.
I’ll show you the one-year Morningstar chart for each stock, with a “weekly” frequency setting that allows you to see trends without the noise of daily movement. I’m also rounding the prices to whole dollars to keep things simple. Let’s look at how each of these stocks has traded over the last year and we’ll take a closer look at selling approaches to each one in the next section:
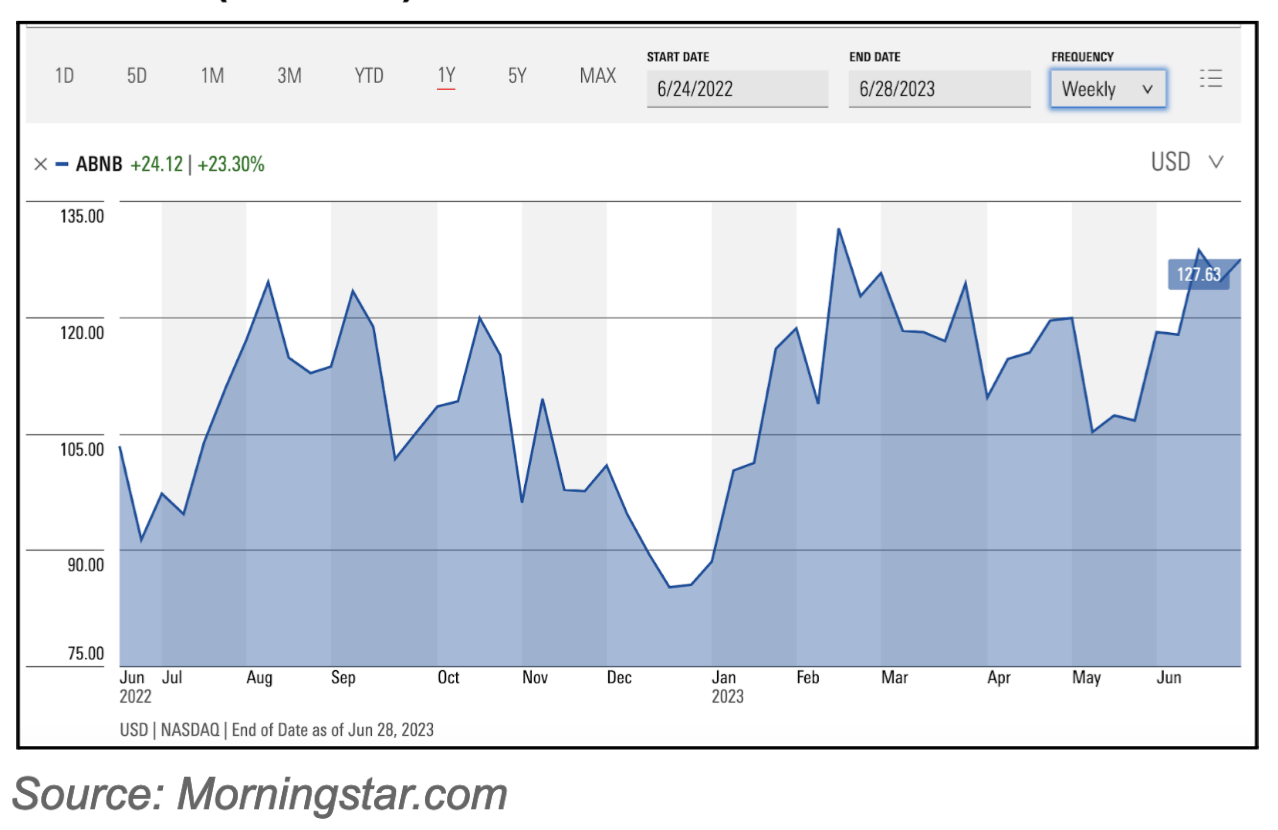
1. Airbnb (ABNB)
The stock’s overall performance:
All-time high: $220 on February 11, 2021
All-time low: $82 on December 28, 2022
Drop from top to bottom: 63%
The stock’s performance over the last year:
52-week high: $145
52-week low: $82
Split price: $114
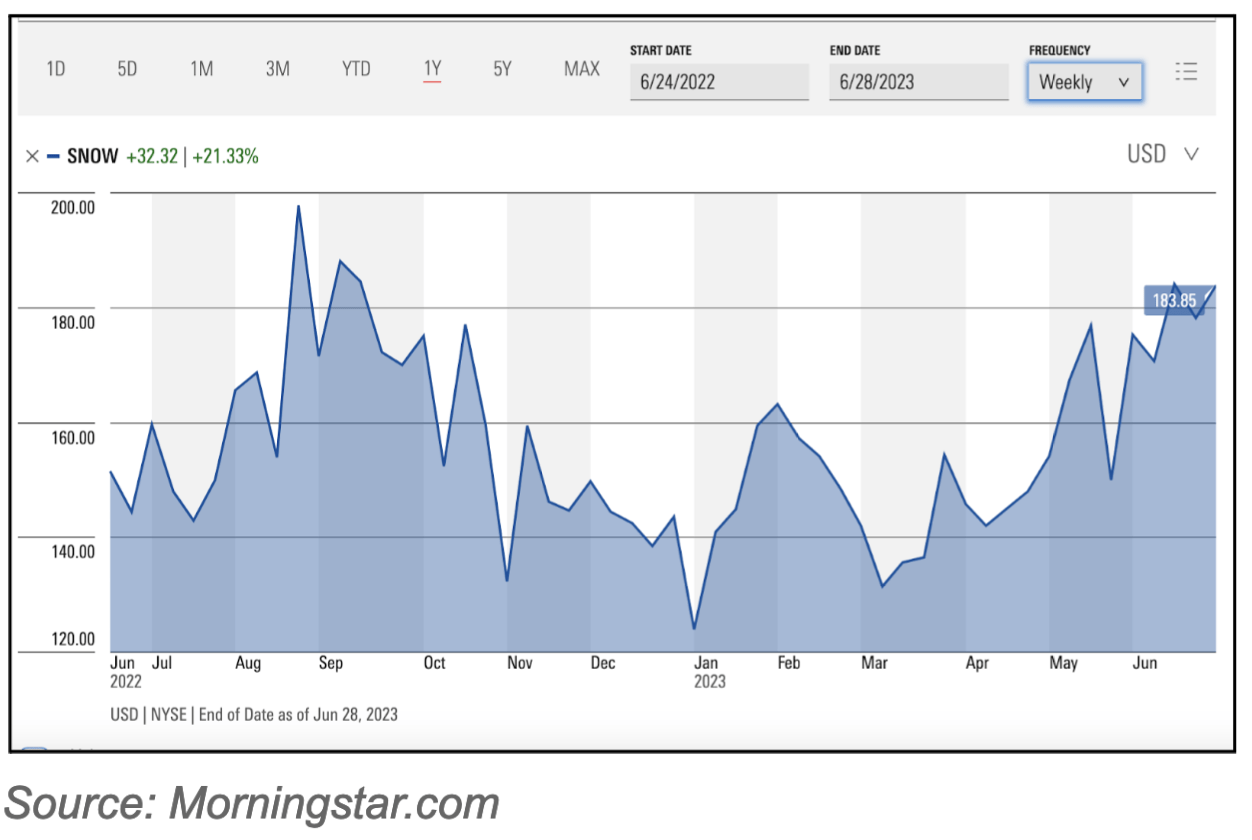
2. Snowflake (SNOW)
The stock’s overall performance:
All-time high: $405 on November 17, 2021
All-time low: $110 on June 14, 2022
Drop from top to bottom: 73%
The stock’s performance over the last year:
52-week high: $206
52-week low: $119
Split price: $162
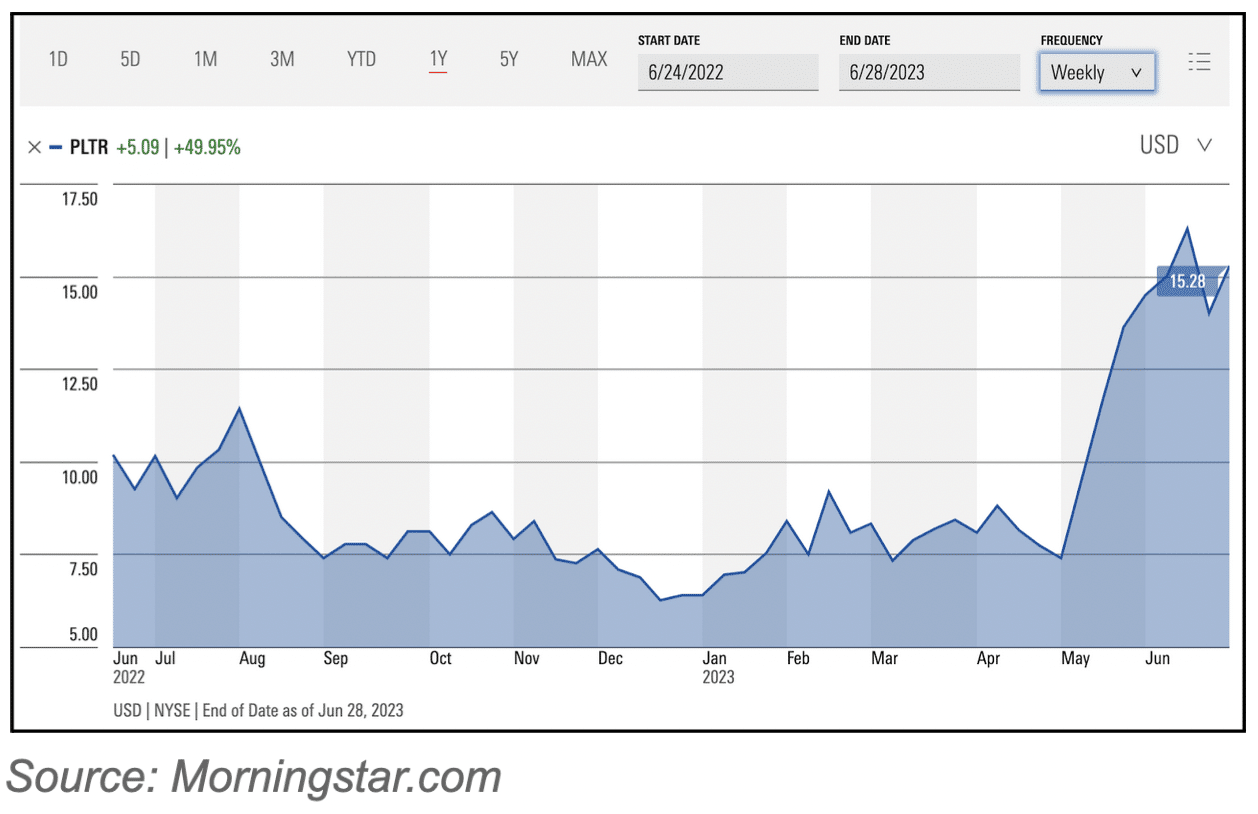
3. Palantir (PLTR)
The stock’s overall performance:
All-time high: $45 on January 27, 2021
All-time low: $6 on December 28, 2022
Drop from top to bottom: 87%
The stock’s performance over the last year:
52-week high: $17
52-week low: $6
Split price: $12
When you take a step back and look at the big picture, the overall stock market saw a rise from the start of 2021 until it began to dip in the fall of 2021 through late 2022 or early 2023.
When comparing the three stock charts above, it’s pretty clear that individual results may vary despite trends in the overall market. There’s no predictability when it comes to individual stocks, and you can only get historical averages from the aggregation of many individual stocks.
Applying our principles to the 3 stock examples
Note: The “current” prices below were current as of June 19, 2023
1. Airbnb
Current price: $124
Above the split price: yes
The current price is both above the split price and higher than it was a year ago. Zooming into the chart,, if you compare the stock’s price today to its price one month ago, it’s had a steady increase. These are all positive signs to sell.
One thing to consider when planning for a stock that’s performing like Airbnb is your ceiling. At what point would you be happy enough with the price to sell a certain percentage of your shares? Once you reach your ceiling and make a sale, repeat the exercise for your remaining shares and set a new ceiling to determine when your next sale will be. You’ll also want to set a floor to account for your stock possibly decreasing. How low would you let the price go before triggering a sale to cut your losses?
2. Snowflake
Current price: $181
Above the split price: yes
Similar to Airbnb, Snowflake’s stock is higher today than it was a year ago and above the split price. However, Snowflake has a much more volatile performance, which its chart’s drastic peaks and troughs illustrate.
If you’re holding a stock with similar performance to Snowflake, a plan is especially critical because timing can make or break your sale. Set both a ceiling and floor price, and update these target prices over time. While the stock’s performance in the last month still shows some volatility, it’s a bit less noisy than Snowflake’s performance from the past year. I won’t sugar coat it: having a stock like Snowflake probably means you’re in for a bumpy ride. That’s why having a solid sales plan with a set floor and ceiling is especially important here.
3. Palantir
Current price: $15
Above the split price: yes
What makes Palantir’s performance interesting is the way in which it reached its current price. For most of the last year, the stock operated within a narrow range up until mid-May, when it broke through to a much higher price and reached its 52-week high in the last month. When zooming into Palantir’s performance just this past month, there’s quite a bit of volatility.
Palantir’s price the last couple of months is so much higher than its previous performance that it just may be a temporary spike rather than a long-lasting change in trajectory. If your stock has a similar performance to Palantir, now may be a great time to sell. Consider your ceiling price, and be especially sure to set your floor to avoid catastrophic losses.
You’re one step closer to a solid sales plan
I hope you feel at ease knowing you can make things right now that you’re equipped with the tools to devise a selling strategy. But remember, this isn’t the time to DIY your finances.
Odds are the mistakes you made in 2021 by not selling and enduring extreme losses in 2022 are because you weren’t working with a financial professional who could recognize your best opportunities to sell. The cost of making mistakes in your sales plan can often dwarf the cost of getting good financial advice, so don’t be afraid to invest in your plan upfront.
I encourage you to be proactive and book a call today to talk to myself or another expert on our team about when and how to sell your stock.